Analytics
The Analytics section allows you to create reports that present, on a customisable dashboard, statistics that you collect from your flows.
These analytics belong to the data records that are inserted into the flows, so they will be removed if these records are deleted.
Collecting analytics
There are two ways to collect analytics in a flow:
Using the Analytics app.
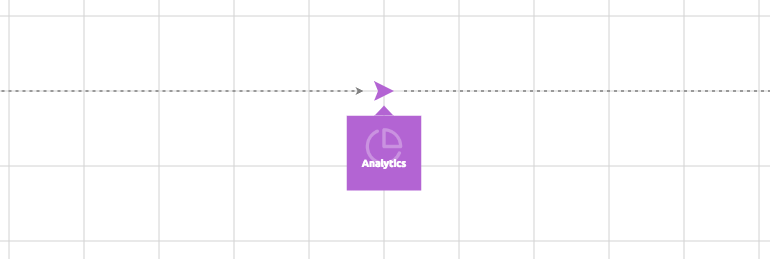
Adding analytics to each flow object by making use of the analytics tab.
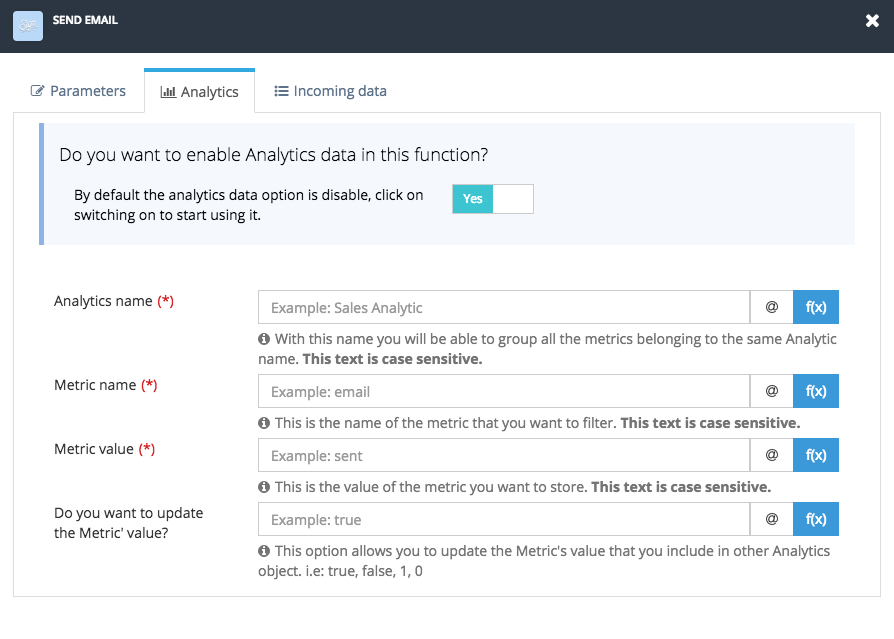
Here we must enter the following data:
- Analytics name: all analytics with the same name will be grouped.
- Metric name: the metric to be filtered.
- Metric value: the value to be stored.
- Do you want to update the Metric’s value?: whether to update or not the metric value.
Overview
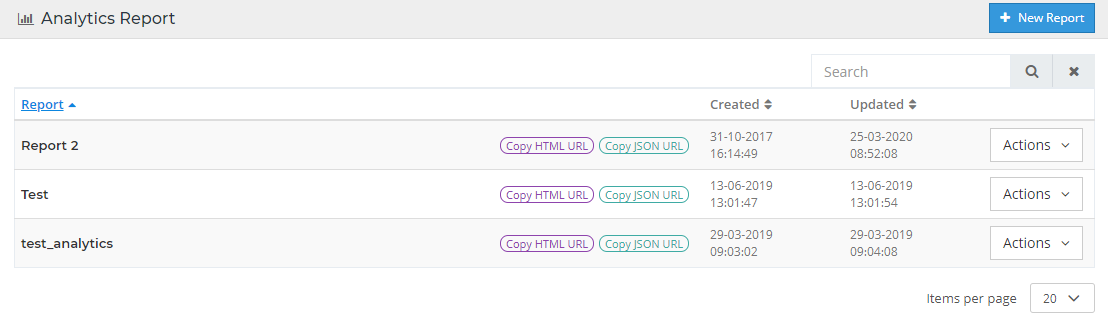
As we can see in the screenshot above, this overview contains all reports that have been set up in your account.
Report information
You can see some information about a report divided into these columns:
| Column | Usage |
|---|---|
| Report | It contains the name of the report and the URL to the dashboard where the charts are shown. You can also have the possibility to get the charts data as JSON so that you can build your own solution out of the data |
| Created | This is the date when the report was created |
| Updated | This is the date when the report was updated for the last time |
Report actions
| Action | Usage |
|---|---|
| Edit | This option will take us to the report screen where we can manage the report charts |
| Duplicate | This option will allow us to créate a clone of the Report so we can later on modify it |
| Delete | This option deletes the report |
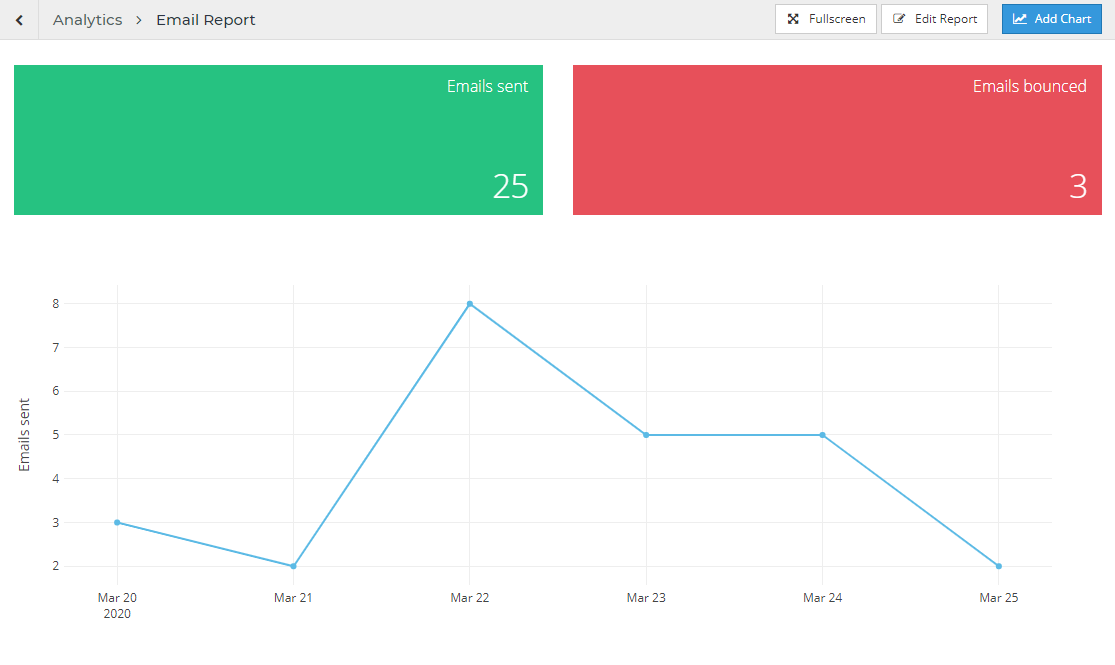
Report view
In this view, you can set up the charts that will present all statistics collected by your flows. You can add as many as you want, depending on your needs. There are several types of charts available: counter, line, column, bar and chart. These charts can be reordered, deleted and configured anytime.
Chart Options
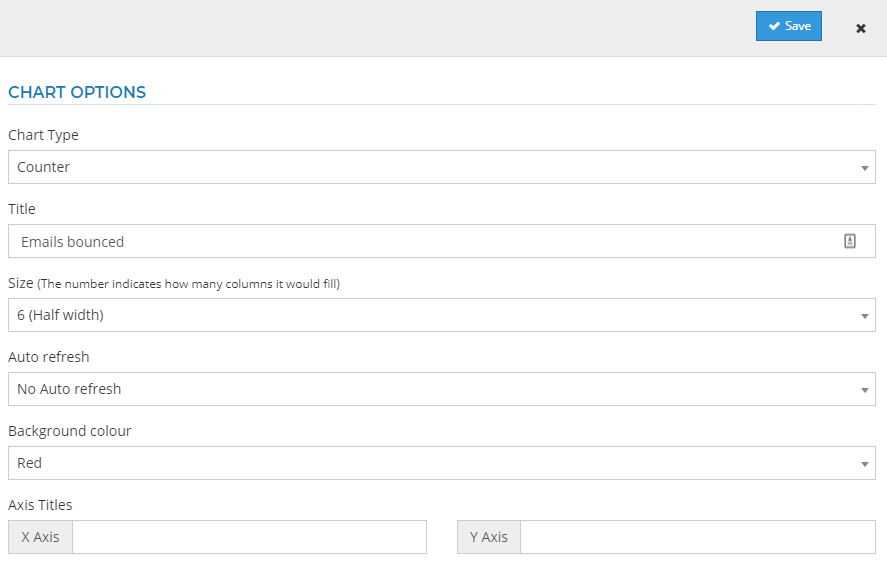
In this section, you can configure some settings about how the chart is going to be displayed.
All properties are shared among charts, but the "Background colour" is only available for "Counters".
| Setting | Usage |
|---|---|
| Chart Type | Defines the type of chart that we want to show |
| Title | Defines the title of the chart |
| Size | Defines how many columns the chart will fill |
| Auto-refresh | Defines how often the chart must be updated |
| Background colour | The background colour of the chart |
| Axis Titles | The titles to show on the X and Y-axis |
Data options
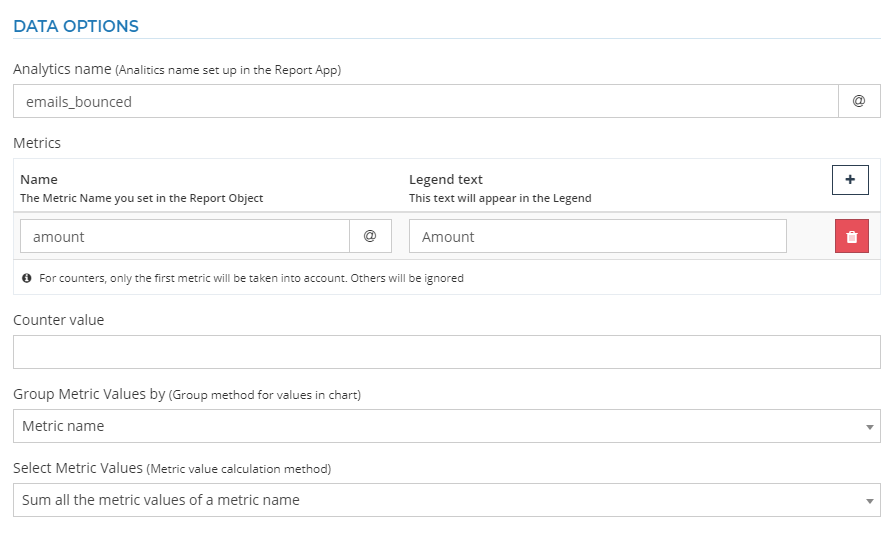
In this section you can define which data will be displayed in this chart.
| Setting | Usage |
|---|---|
| Analytics name | It's the name that will be used, later on, in the Analytics object and the Analytics tab |
| Metrics | You can define several metrics that are going to be displayed by the chart |
| Counter value | It's the metric value to be counted. If you set it, it will only count those values of the first metric name |
| Group Metric Values | This determines the way the values are going to be grouped in the chart |
| Metric values | This defines the way the values will be calculated |
Date Options

In this section you can choose the range of dates to gather data within. You have two options:
Fixed dates. In this option, you will need to define from which date to which date you want your data.
Date Intervals. In this option, you choose which range of dates are going to be shown. These are them:
Setting Usage Today It will only show data from today, starting at 00:00:00 till 23:59:59 of today Yesterday It will only show data from yesterday, from 00:00:00 to 23:59:59 Yesterday and today It will only show data, starting yesterday at 00:00:00 till today at 23:59:59 Last 7 days It will display data from the previous seven days till today Last 14 days It will show data from the previous fourteen days till today
Analytics dashboard
The analytics dashboard can be accessed by opening its URL on any browser. This URL can be found in the overview.